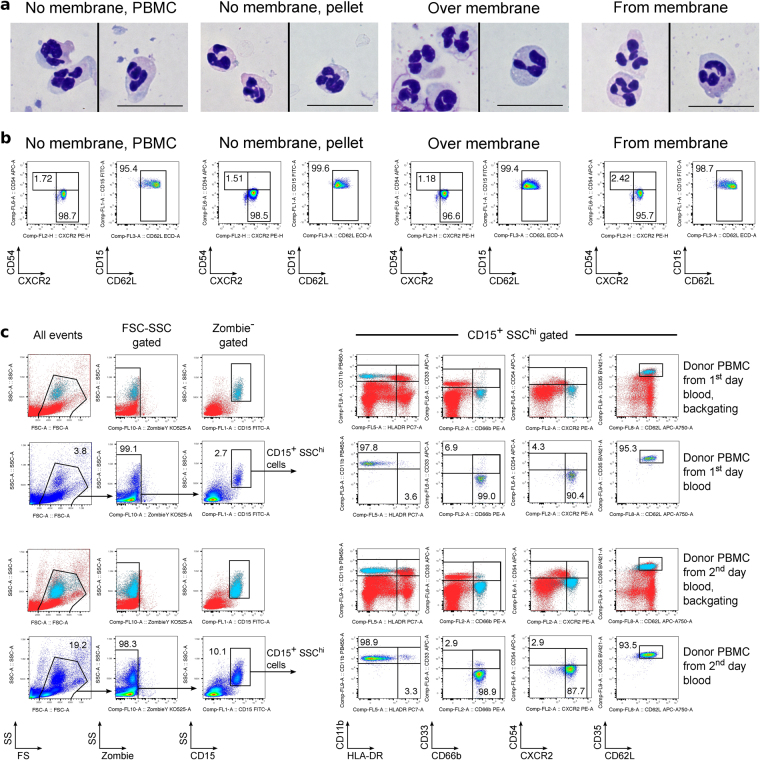
Figure 3.
Evaluation of CD15+ cell phenotype. (a–b) PBMC from one day-old healthy donor blood were isolated over Ficoll using conventional tubes (“No membrane, PBMC” and “No membrane, pellet”) or with Accuspin tubes (“Over membrane” and “From membrane”). (a) By light microscopy, a typical neutrophilic appearance was seen. (b) The same cells as in (a) were stained for CD15 and activation markers, CXCR2, CD54 and CD62L. CD15+ gated cells are shown, and representative for 7 independent experiments. (c) PBMC from healthy donor blood sample were isolated the same day, or next day, over Ficoll using non-membrane tubes. On the left: non-altered, good viability and typical FSC-SSC properties of neutrophils are shown in pseudocolor plots. Additionally, location of CD15+SSChi population of neutrophils is shown by backgating (neutrophils are blue). On the right: 2nd and 4th rows show the full phenotype of gated CD15+SSChi neutrophils, while 1st and 3rd rows identify the same CD15+SSChi population (blue) within the same markers on axes, but compared to the staining of all viable cells (backgating). Presented dot plots consist of 23,728 ± 7,040 (Mean ± SEM) events, not including events in the first column of ungated cells, i.e. left panels of (c).

