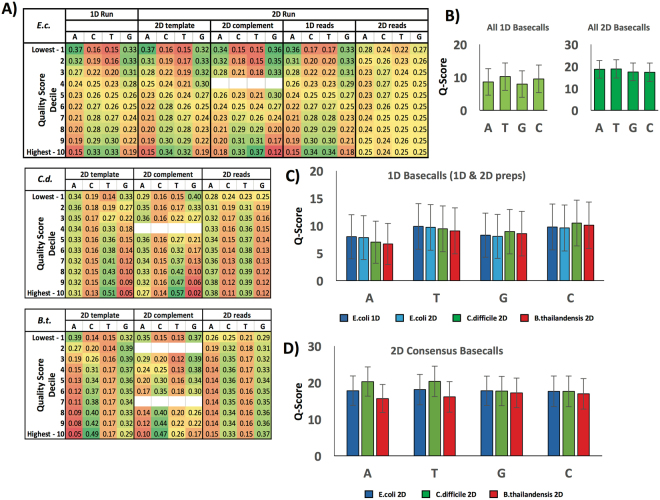
Figure 4.
(A) Heat map chart showing probability of basecalls in a particular Q-score decile being A, C, T or G. After dividing base Q-scores into deciles (as in Fig. 3), the probability that the base is A, C, T or G, given a Q-score decile was calculated. 1D and 2D data are shown for E.coli (top), while only 2D run data are shown for C. difficile (middle) and B. thailandensis (bottom). Note – rounding error may cause some groupings to appear not to sum to 1.00 even though the unrounded numbers do. (B) Averages of Q-scores per base for C. difficile, E. coli and B. thailandensis data. (C) Average data in (A) for 1D and 2D (template only) reads, broken down by organism. (D) Data in (A) for 2D consensus reads, broken down by organism.

