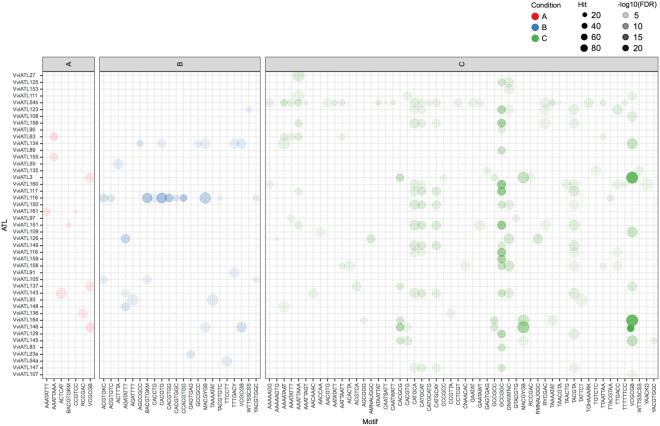
Figure 4.
Enrichment of cis-acting regulatory elements (CAREs) in grapevine ATL subnetworks under different conditions. The different ATL subnetworks displaying CARE enrichment (FDR < 0.01) are indicated on the left. A, B and C as well as ball color indicate the abiotic (red), biotic (blue) and condition-independent (green) datasets, respectively. Ball size represents the number of genes in each ATL subnetwork containing a given CARE (20–80), whereas ball opacity represents the false discovery rate (FDR) expressed as −log10(FDR), thus the higher values (represented by darker shading) indicate a higher statistical significance.

