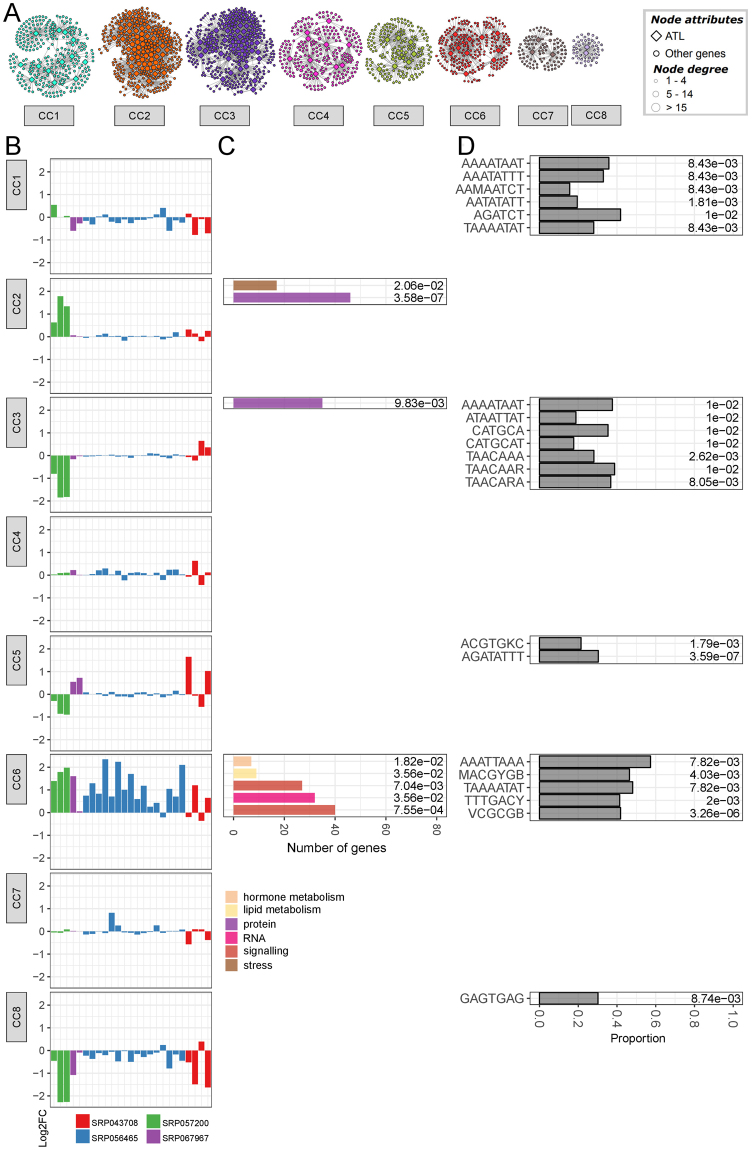
Figure 6.
Combined grapevine ATL gene co-expression biotic network. (A) The biotic network was constructed using the average log2FC matrix comparing treatment vs control for the different biotic stress-related conditions. Node color represents the assigned community cluster within the network. Diamonds designate grapevine ATL genes, whereas balls represent co-expressed genes. Ball size represents node degree, i.e. the number of connection for each node, as indicated. (B) Representation of gene expression in the 8 different biotic community clusters according to the log2FC calculated for each condition. The different colors represent the different experimental datasets (see Supplementary Material for experiment details). (C) Distribution of enriched MapMan BIN categories in the 8 different biotic community clusters. Only the first two levels of the MapMan BIN category hierarchy were shown. Bar color represents the different enriched MapMan BINs, while bar size represents the number of genes of assigned to a given MapMan BIN. On the right of each chart is reported the FDR value calculated for each enrichment. (D) Enrichment of cis-acting regulatory elements (CAREs) in the 8 different biotic community clusters. Bar size represents the proportion of co-expressed gene of a given cluster containing a given CARE, while on the right of each bar is reported the FDR value calculated for each CARE enrichment. FDR, false discovery rate.

