
Figure 5.
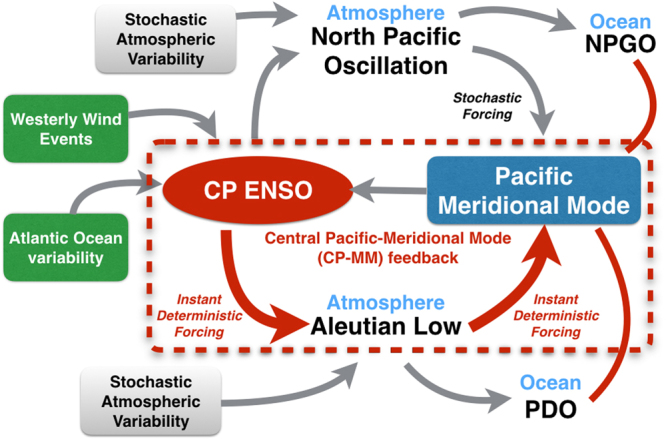
Schematic for the discussed mechanisms (motivated by Fig. 3 in Di Lorenzo et al.10). Grey arrows indicate previously identified pathways (refer to the Introduction section for details) and red arrows the new pathways proposed in this study that enable an instantaneous positive feedback between CP ENSO and PMM (encircled by the dashed red line), which is able to explain the observed close CP ENSO/PMM relationship at zero lag on all climate timescales. The solid red lines indicate close relationships between PMM, PDO, and NPGO at low-frequencies. Note that stochastic processes can affect (in differing strength) each of the pathways indicated by arrows.