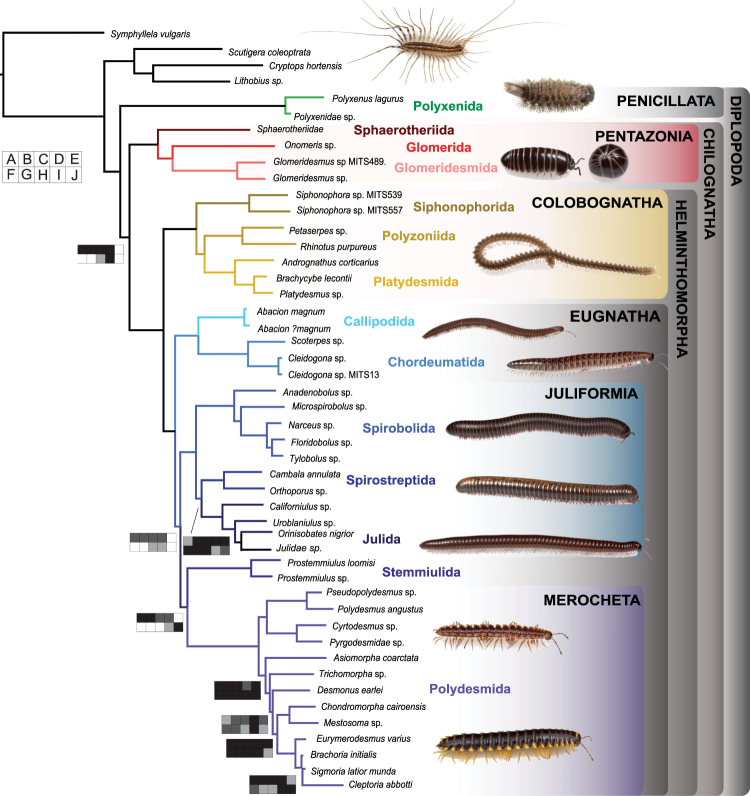
Figure 1.
Maximum likelihood tree with branch lengths obtained from analysis of matrix M1. Tree is rooted with Symphylella vulgaris. Bootstrap support (BS) values for all analyses are summarized. BS values not indicated are 100%. Boxplots indicate bootstrap value ranges for each node across all analyses (A–J). Black boxes represent 90–99% BS, dark grey boxes 70–89% BS, light grey boxes BS less than 69% BS, and white boxes where the node whas not recovered for the analysis. (A) ExaML optimal ML tree for matrix M1. (B) ExaML optimal ML tree for matrix M2. (C) ExaML optimal ML tree for matrix M3. (D) ExaML optimal ML tree for matrix M4. (E) ASTRAL greedy consensus tree for matrix M1. (F) ASTRAL greedy consensus tree for matrix M2. (G) ASTRAL greedy consensus tree for matrix M3. (H) ASTRAL greedy consensus tree for matrix M4. (I) ExaML optimal ML tree for matrix M5. (J) ExaML optimal ML tree for matrix M6.

