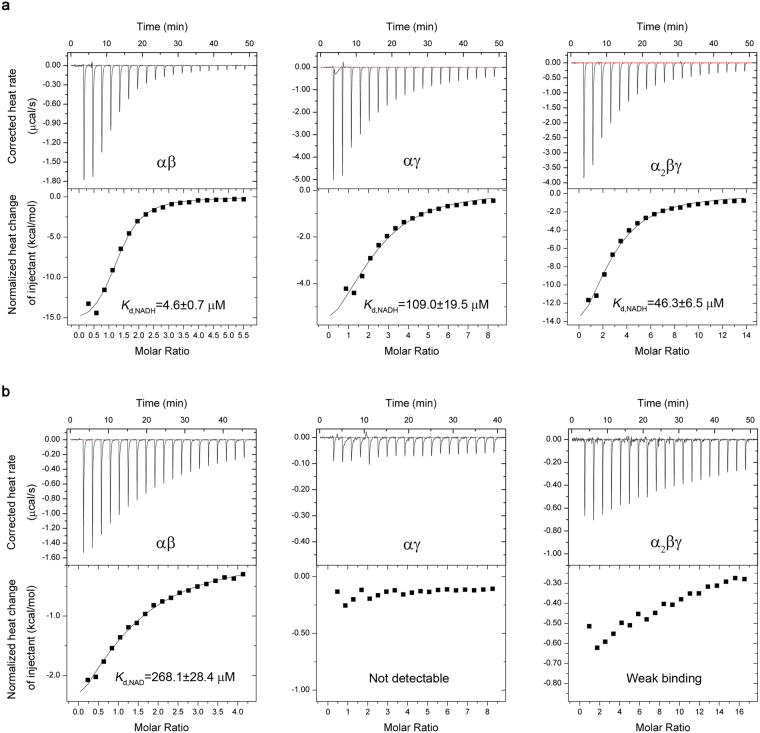
Figure 2.
Binding of NADH (a) and NAD+ (b) with the αγ, αβ and α2βγ enzymes of human NAD-IDH measured by ITC at 20 °C. The concentrations of titrand (protein) and titrant (NADH or NAD+) in the measurements are listed in Table 1. The corrected heat change was obtained by subtracting the heat of dilution from the measured heat change, and the normalized corrected heat change of injectant was plotted against the molar ratio of titrant vs. titrand. The values of thermodynamic parameters were derived from the titration curve by fitting the experimental data using a nonlinear least-squares method with the single set of binding sites model and are summarized in Table 1. The dissociation constant Kd values are shown in the figure.

