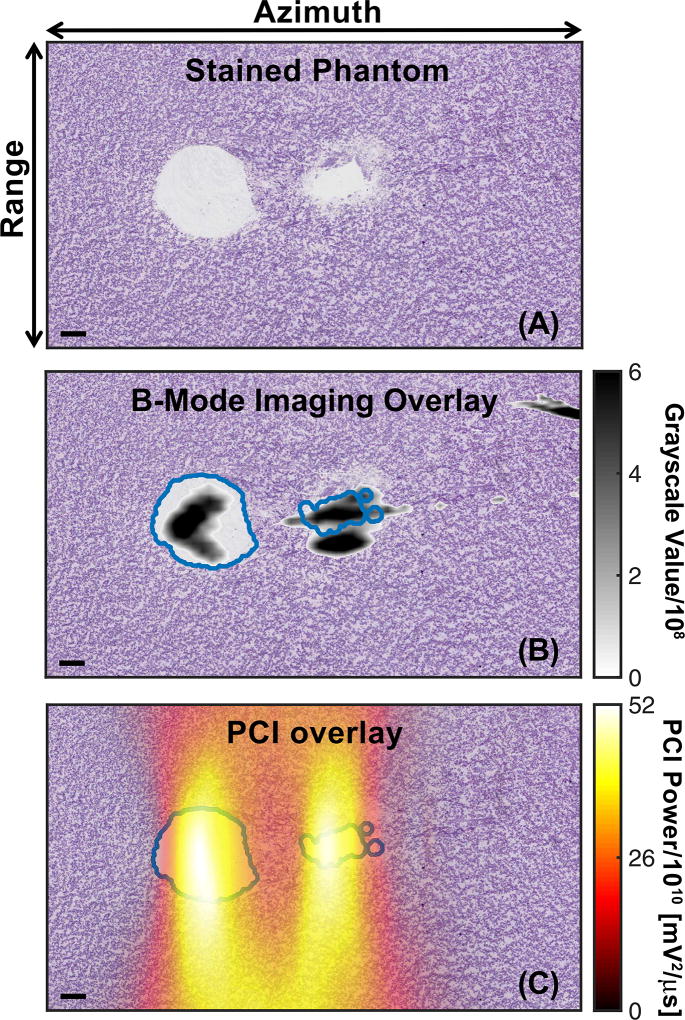
Fig. 3.
(A) Phantom after PAS stain to demark liquefaction (white) generated by histotripsy insonation. (B) Comparison of co-registered plane wave B-mode image and processed phantom image. (C) Comparison of co-registered Passive Cavitation Image (PCI) and processed phantom image. Both the PCI and plane wave B-mode images were summed over 400 frames (the duration of the histotripsy insonation) to create cumulative images. For panels B and C, the liquefaction zone boarders are outlined in blue. The histotripsy pulse (1-MHz center frequency, 5-µs pulse duration, 23-MPa peak negative pressure) propagated from left to right in the image. The bar in the lower left corner of each image corresponds to 1 mm. The azimuthal/range dimensions of the imaging plane are indicated in the top panel.

