Figure 3.

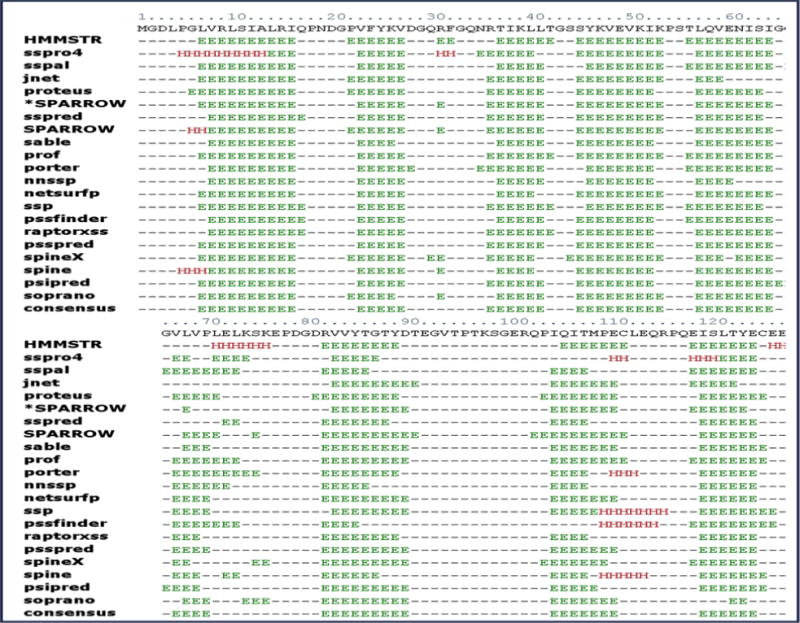
The secondary structure of CRIP1b predicted by various protocols, the consensus of results was taken into account to estimate secondary structural content in CRIP1b. The beta sheets are represented by ‘E’ and alpha helices by ‘H’.

The secondary structure of CRIP1b predicted by various protocols, the consensus of results was taken into account to estimate secondary structural content in CRIP1b. The beta sheets are represented by ‘E’ and alpha helices by ‘H’.