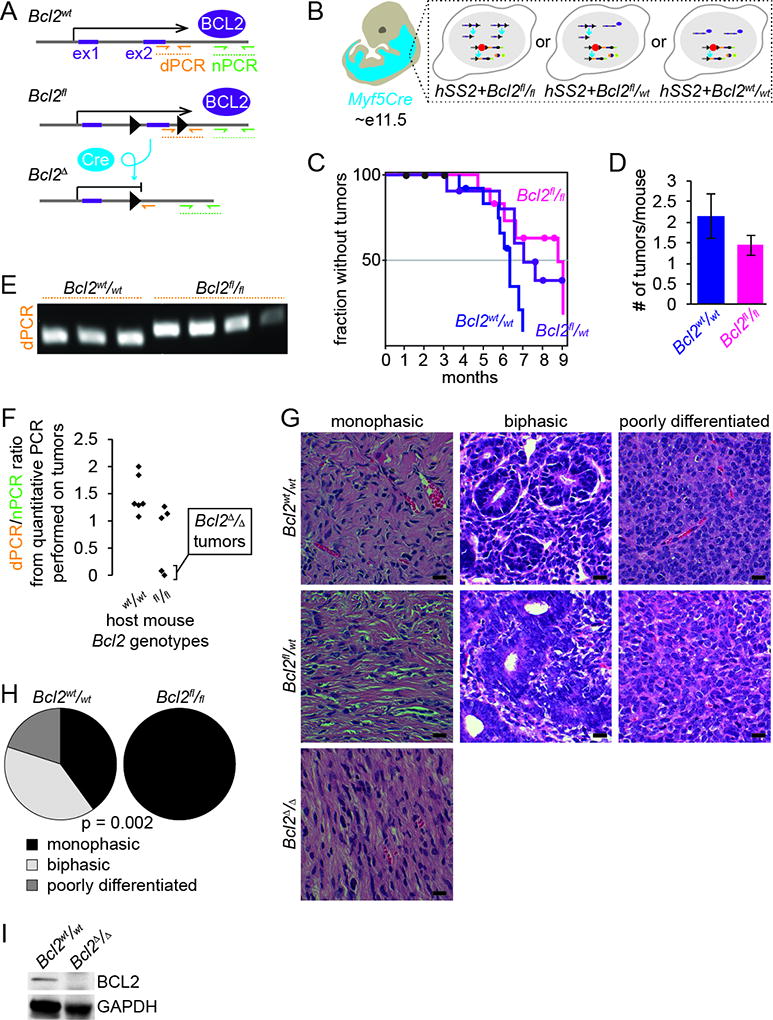
Figure 2. Bcl2 conditional deletion in synovial sarcoma mildly disrupts sarcomagenesis.

A. Schematic of alleles for Bcl2fl/fl with its respective recombination product. Also demonstrating the location of primers for detection of the recombined allele (dPCR) and the primers for normalization (nPCR).
B. Schematic of Myf5Cre+ distribution in E11.5 embryo resulting in the expression of hSS2 or hSS2;Bcl2fl/fl during embryogenesis.
C. Kaplan-Meier plot of the nonmorbid fraction of hSS2;Bcl2fl/fl (pink), hSS2;Bcl2fl/wt (purple) and hSS2;Bcl2WT (blue) induced in Myf5Cre+ mice. Statistical difference (Log-rank test) between hSS2;Bcl2fl/fl and hSS2;Bcl2WT, p value = 0.03.
D. Graph depicting the average number of tumors per mouse between hSS2;Bcl2fl/fl and hSS2;Bcl2WT, genotypes (p value = 0.34).
E. PCR detection of the recombined Bcl2fl/fl allele compared to wildtype.
F. Quantification of the recombined Bcl2fl/fl allele normalized to adjacent primers, demonstrating that not all Bcl2fl/fl tumors recombined to delete Bcl2.
G. Photomicrographs of H&E histology examples of monophasic, biphasic, and poorly differentiated synovial sarcomas from hSS2;Bcl2WThSS2;Bcl2fl/wt and hSS2;Bcl2fl/fl mice induced in Myf5Cre+ cells.
H. Fraction of monophasic, biphasic, and poorly differentiated histologies in Myf5Cre;hSS2;Bcl2WT and Myf5Cre;hSS2;Bcl2fl/fl mice.
I. Immunoblots detecting the absence of BCL2 in fully recombined tumors following TATCre injection from hSS2;Bcl2fl/fl mice compared to tumors from hSS2;Bcl2WT mice.
(All magnification bars = 10 µm)
