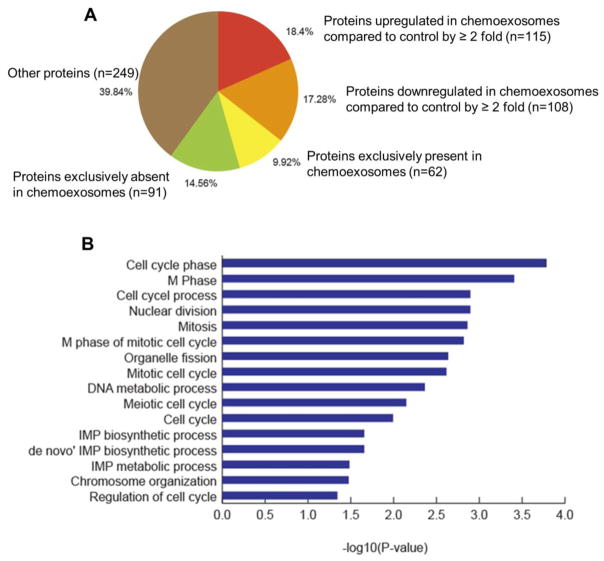
Fig. 5.
(A) Proteomic analysis of exosomes. Proteins identified in exosomes secreted by cells not treated (control exosomes) or treated with bortezomib (chemoexosomes) were classified based on “normalized total spectra” [NTS] values. Protein with NTS value of >=1 in chemoexosomes and 0 in control exosomes were referred to be exclusively present, while those with 0 NTS value in chemoexosome and >=1 in control exosomes were considered as exclusively absent. In addition, proteins with non-zero NTS values in both chemoexosome and control exosome were used to identify up-regulated and down-regulated proteins (fold change of 2 or more). (B) Gene ontology enrichment analysis was performed using DAVID (Database for Annotation, Visualization and Integrated Discovery) v6.8 [43] to understand the biological role of proteins that were found to be exclusively present in chemoexosomes compared to control exosomes. The functional annotation chart was derived with default parameters (gene count of 2 and EASE of 0.1). Statistically enriched GO biological processes specific to gene set were identified (p-value <0.05).

