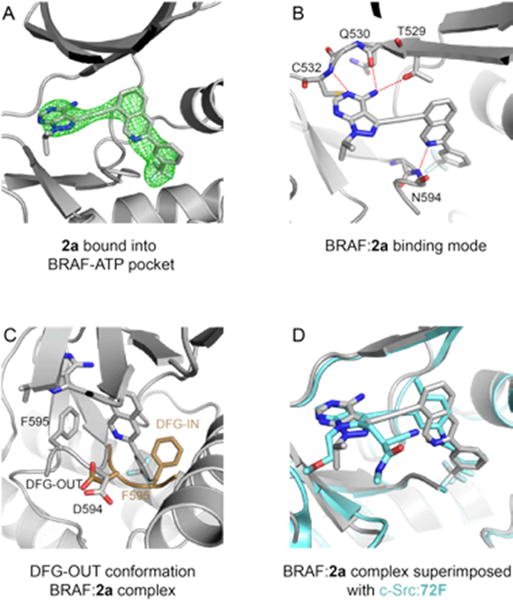
Figure 3.

Crystal structure of 2a in complex with the BRAF kinase domain. (A). Unbiased Fo-Fc electron density maps contoured at 2.5σ in green showing 2a bound to the ATP binding pocket of BRAF kinase domain. (B). Binding mode of 2a with the BRAF ATP-binding pocket. Compound 2a and BRAF residues interacting with 2a are represented in stick. Red dash lines represent hydrogen bonds. (C). The BRAF protein adopts a DFG-out conformation when bound to 2a. The DFG loop of the BRAF:2a complex is colored in grey (adopting the DGF-out conformation). An example of a DFG loop of BRAF adopting the DFG-in conformation (PDB 4WO5) is superimposed in brown. (D). Superimposition of the BRAF:2a complex in grey with the c-SRC:72F complex in blue (PDB 5SYS).
