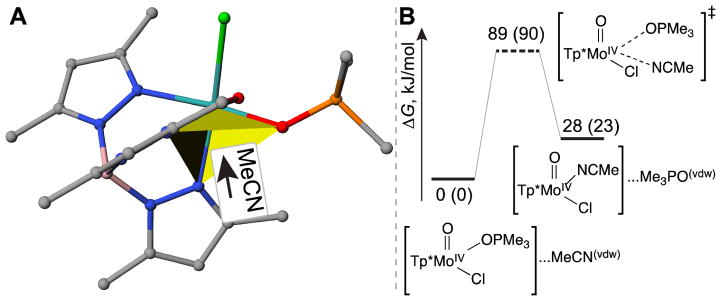
Figure 6.
Depiction of the attacking orientation for acetonitrile molecule (A), and the corresponding free energy diagram (B) in the Ia-NNO mechanism in the absence of HPyr+. The numbers denote the enthalpies of compounds relative to the reactant, and numbers in parentheses denote the corresponding Gibbs free energy changes (kJ/mol).

