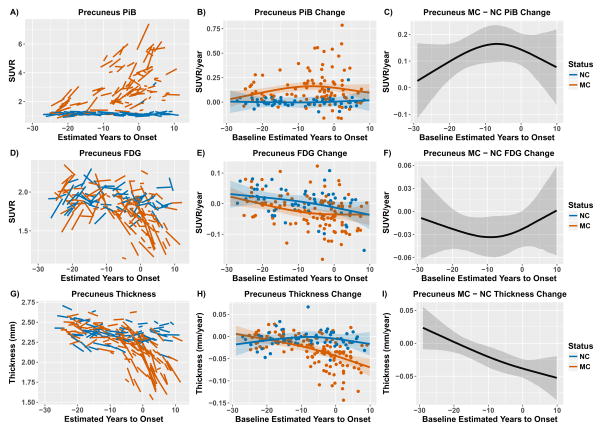
Figure 1.
Modeling longitudinal change in the precuneus for PiB (top), FDG (middle), and cortical thickness (bottom). The left-hand panels (A, D, & G) depict the model estimates of longitudinal biomarkers. The middle panels (B, E, & H) depict the estimated rate of change across the course of the disease for mutation carriers and non-carriers. Individual random effect slope estimates are plotted as colored dots. The right hand panels (C, F, and I) depict the difference in rate of biomarker change between mutation carriers and non-carriers across the course of the disease. For both the middle and right-hand panels the shaded areas represent 99% credible intervals around the model estimates. The credible intervals are drawn from the actual distributions of model fits derived by the Hamilton Markov Chain Monte Carlos analyses. Any point in this difference curves where the shaded area is not touching the zero axis is a point in the disease progression (as measured by EYO) where the biomarker accumulation rate is different between groups. The first EYO point that was significantly different between groups was considered the initial diverge between groups. Figures depicting the model results for every ROI are available in supplemental materials. To avoid inadvertently revealing mutation status figures are displayed with baseline EYO −29 to +10.

