Figure 3.
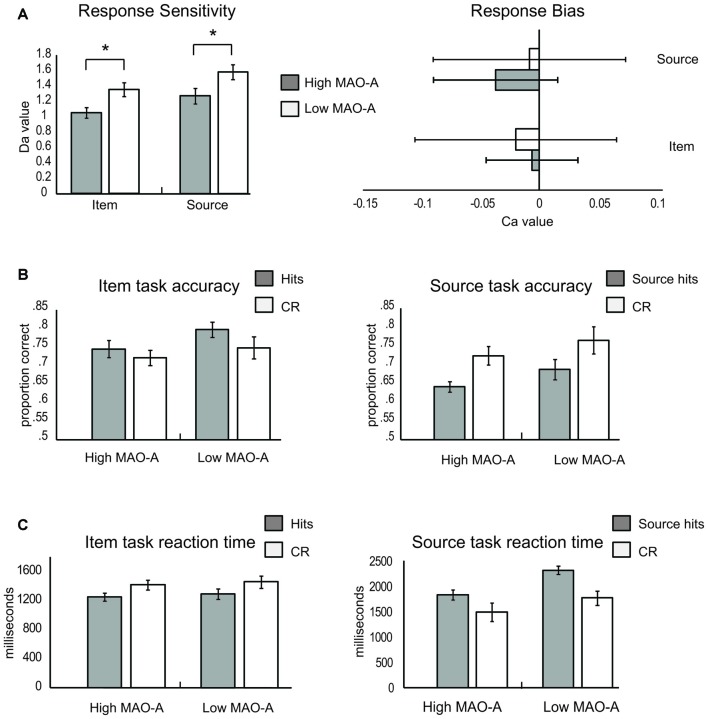
Item and source memory results. (A) Response sensitivity (left) and response bias (right) during the item and source memory tasks. High monoamine oxidase A (MAO-A) groups are represented by light gray bars and Low MAO-A groups by white bars. Response sensitivity (left panel) was lower in the High MAO-A groups during both item and source memory. There was no difference in response bias (right panel) between groups. (B) Item (left) and source (right) memory accuracy. The left graph illustrates the proportion of responses where a previously presented item was successfully identified as old (hits; gray) and where new items were successfully classified as new (correct rejections, CR, white) for High and Low MAO-A groups during item memory. No differences in accuracy were observed between groups during item memory. The right graph illustrates proportions correct during source memory. The gray bars represent the proportion of trials where source information was correctly identified (source hits). The white bars are the proportion of trials where new items were successfully classified as new (CR) for High and Low MAO-A groups during source memory. The proportion of source hits was significantly lower than correct rejections. (C) Item (left) and source (right) reaction time results. Hits were faster than CR across groups during item memory (left panel). During source memory, hits took longer than correct rejections (right panel). In addition, individuals with the High MAO-A phenotype were significantly faster during both hits and CR. *Indicates a significant difference at alpha level of 0.05.

