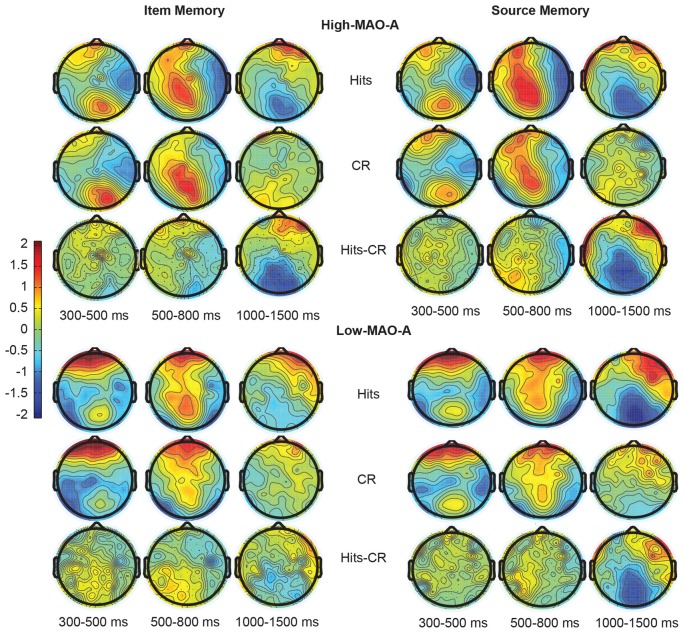
Figure 4.
Topographic maps representing the distribution of ERP responses during item (left) and source (right) memory. The top two panels represent ERP responses in the High MAO-A group during Hits (top), correct rejections (CR; middle), and the difference between the hits and CR (bottom) 300–500 ms, 500–800 ms, and 1000–1500 ms post-stimulus presentation. The Low MAO-A group ERP responses are displayed in the bottom two panels with item memory on the left and source memory on the right. Hits for source memory are source hits where the source was correctly identified.

