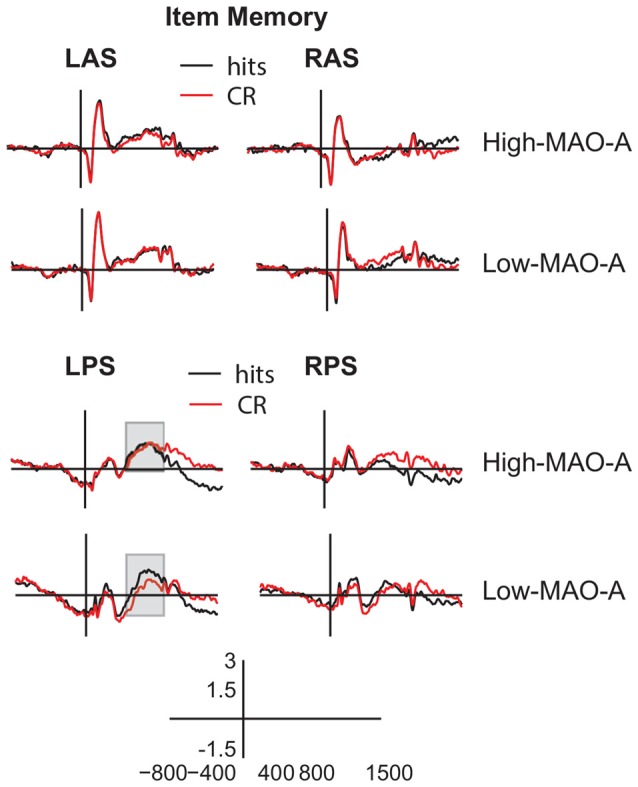
Figure 5.

ERP waveforms during item memory retrieval. Averaged ERP waveforms from −800 ms to 1500 ms post-stimulus presentation (y axis crosses at 0 ms) in the left anterior superior (LAS, top left panels), (RAS, top right panels), left posterior superior (LPS, bottom left panels), and right posterior superior (RPS, bottom right panels) ROIs for hits (black) and CRs (red) during the item memory task. The gray boxes highlight the 500–800 ms timeframe in LPS where the High MAO-A and Low MAO-A groups showed significant differences in the parietal old/new effect.
