
Figure 3.
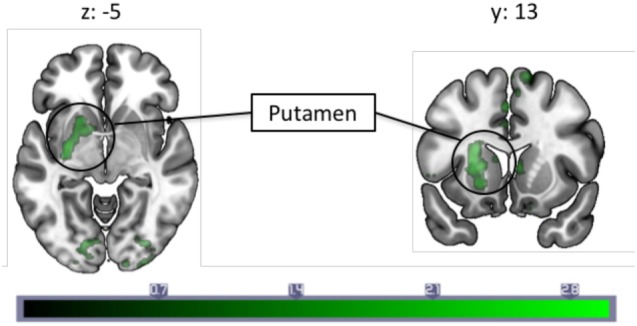
A correlation analysis with monthly migraine frequencies and pain-induced periaqueductal gray connectivity revealed a negative correlation with connectivity to the left putamen. Each slice is numbered with the respective Montreal Neurological Institute coordinate. Color bar indicates z-statistic.