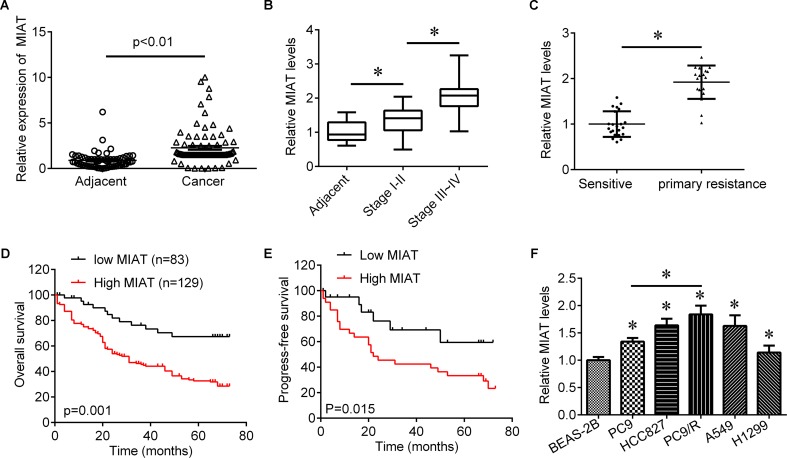
FIGURE 1.
The expression of MIAT in lung cancer tissues. (A) qRT-PCR was used to determine the expression of MIAT in NSCLC tissues (N = 212) and adjacent control (N = 186). (B) The expression of MIAT in adjacent tissues and grade I+II and grade III+IV lung cancer tissues. (C) The expression of MIAT in patients who sensitive (N = 45) or primary resistant (N = 25) to EGFR-TKI. (D) Overall survival analysis in NSCLC patients with low or high MIAT expression. (E) Progress-free survival analysis in NSCLC patients with low or high MIAT expression. (F) The expression of MIAT in BEAS-2B and lung cancer cell lines. ∗P < 0.05.

