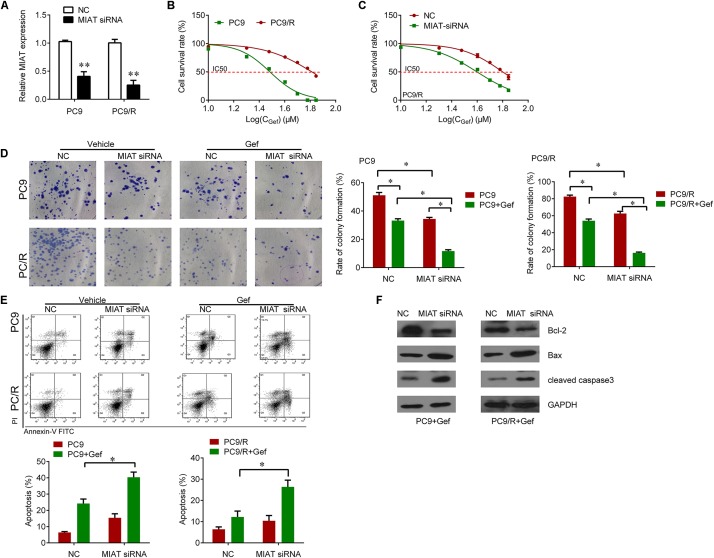
FIGURE 2.
Knockdown of MIAT sensitizes PC9 and PC9/R cells to gefitinib. (A) qRT-PCR analysis for MIAT in PC9 and PC9/R cells after transfection with MIAT siRNA or negative control. (B) CCK-8 assay was used to determine the IC50 in PC9 and PC9/R cells (PC9 vs. PC9/R: 29.05 vs. 62.61 μM). (C) CCK-8 assay was used to determine the change of IC50 in PC9/R cells after knockdown of MIAT (siMIAT vs.NC: 38.2 vs. 60.2 μM). (D) Colony formation assay was used to determine the cell growth after knockdown of MIAT and gefitinib treatment. (E) Flow cytometry was used to measure cell apoptosis after knockdown of MIAT and gefitinib treatment. (F) Western blot analysis for apoptosis marker Bcl-2, Bax and cleaved caspase 3 after knockdown of MIAT and gefitinib treatment. ∗P < 0.05, ∗∗P < 0.01.

