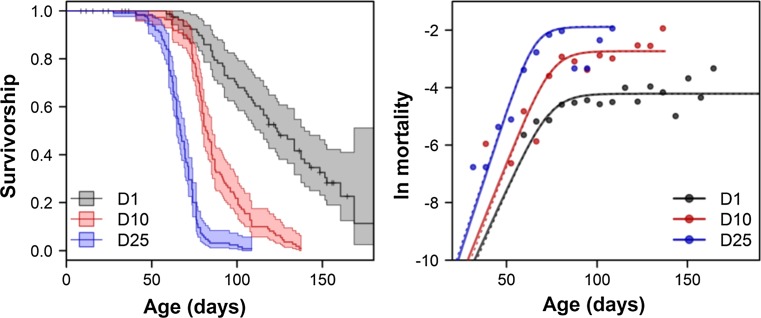
Fig. 1.
Survivorship of medusae and logarithmized mortality rates at different densities. The survivorships (left panel) were based on the Kaplan–Meier estimator of survival. Marker “+” represents censoring events (medusae lost or absorbed by a bigger bud). The empirical mortality rates (right panel) were fitted with a γ-Gompertz model of mortality using a maximum-likelihood method. The solid lines represent the fit of the most parsimonious model that assumes a common a parameter for all densities, whereas the dashed lines (which overlap considerably with the solid lines) represent each population that was fitted separately by this model. The empirical mortality rates are represented as dots that were calculated from 7-day aggregated data

