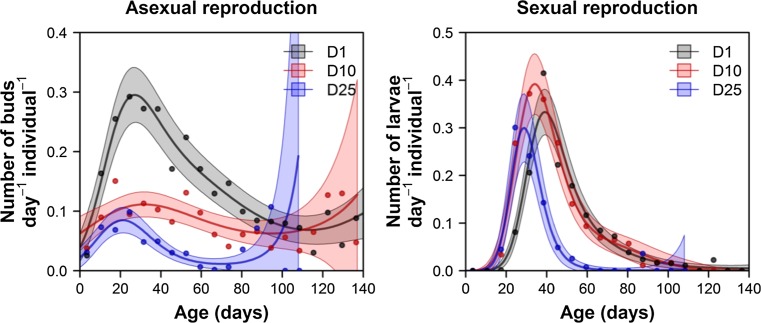
Fig. 3.
Age-specific asexual (a) and sexual (b) reproduction rates. The colors represent different regimes of density: gray (one medusa in a well), red (10 medusae in a well), and blue (25 medusae in a well). The increased asexual reproductive rate of D25 in the higher age classes might be the effect of decreased density in experimental wells due to deaths (dead individuals were not replaced) (but see Discussion)

