Figure 2.
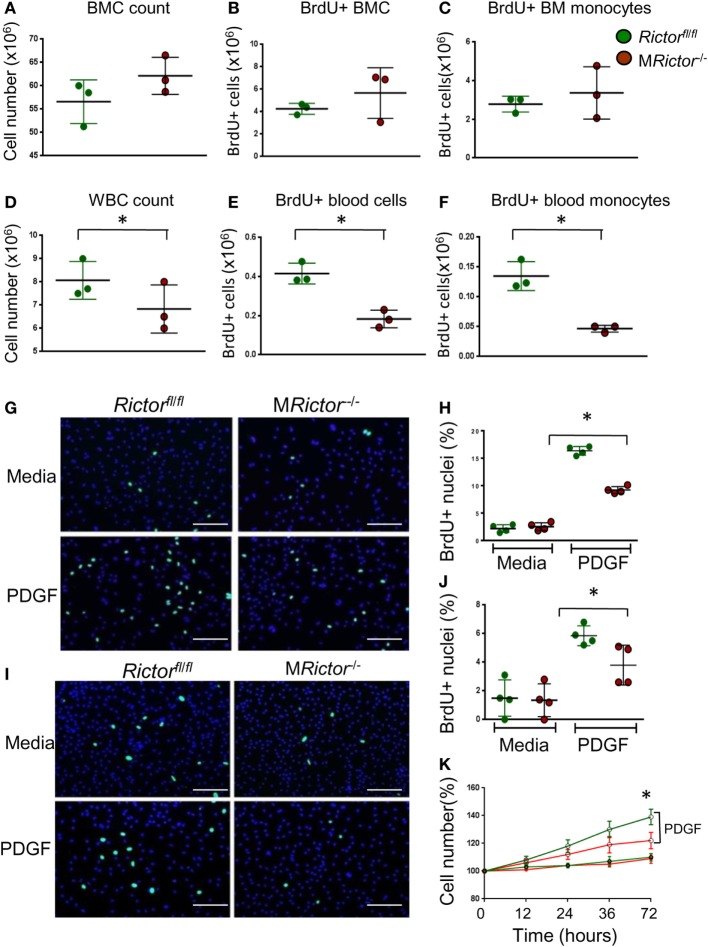
Loss of Rictor suppresses proliferation of blood monocytes and macrophages. (A–F) BrdU (10 ml/kg) was I/P injected into Rictorfl/fl and MRictor−/− mice, 24 h later bone marrow and blood cells were isolated and analyzed by flow cytometry. Note there were no differences in bone marrow cell count, total BrdU+ cells and BrdU+ monocytes (A–C); however, white blood cell count, total BrdU+ blood cells and BrdU+ monocytes were reduced in MRictor−/− compared to Rictorfl/fl mice. Graphs represent data (mean ± SEM) of the experiment with three mice per group (*p < 0.05 compared to control untreated group). (G–J) Blood monocytes (G,H) and peritoneal macrophages (I,J) were isolated from Rictorfl/fl and MRictor−/− mice, and two days incubation in DMEM media containing 10% FBS (and M-CSF for monocytes) treated with or without PDGF (20 ng/ml) and BrdU overnight. The incorporation of BrdU was analyzed under a fluorescent microscopy. Note PDGF treatment significantly increased proliferation but less prominent in MRictor−/− than in Rictorfl/fl cells. Graphs represent data (mean ± SEM) obtained from different mice (n = 4/group; *p < 0.05 t-test analysis compared to Rictorfl/fl cells); Scale bar is 50 mm. (K) WT and MRictor−/− peritoneal macrophages were seeded in triplicate on a 48-well plate and then treated with DMEM media alone or together with PDGF (20 ng/ml) for the indicated times. The cells were counted using an EVOS FL Auto imaging System (Life Technology). Note, top two lines of the graph represent cells treated with PDGF, as indicated.

