Figure 3.
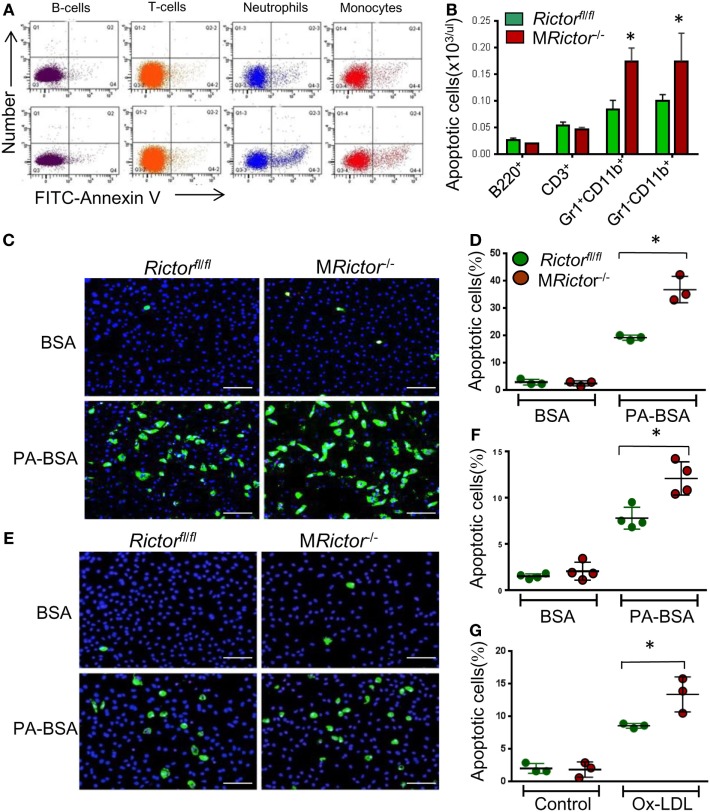
MRictor−/− macrophages are less resistant to different pro-apoptotic stimuli than Rictorfl/fl cells. (A,B) Representative flow cytometry plots of apoptotic blood cells isolated from Rictorfl/fl (top panel) and MRictor−/− mice (bottom panel) and stained with the Alexa Fluor 488 Annexin V. Note increase of apoptosis in blood monocytes and neutrophils of MRictor−/− mice compared to Rictorfl/fl mice. Graphs represent data (mean ± SEM) of the experiment (n = 3/group, *p < 0.05 t-test analysis compared to Rictorfl/fl mice). (C,D) Blood monocytes were isolated from Rictorfl/fll and MRictor−/− mice (n = 3/group), incubated in DMEM media containing 10% FBS, M-CSF for 2 days, and then treated overnight with 0.3 M palmitic acid complexed to bovine serum albumin (PA-BSA) in the presence of 1% FBS and M-CSF. The Alexa Flour 488 Nalge Nunc International/dead cell apoptosis kit was used to detect apoptotic cells. Note PA-BSA treatment significantly increased apoptosis in both group of cells, more prominently in MRictor−/− than Rictorfl/fl cells; scale bars, 50 μm. Graphs represent data (mean ± SEM; *p < 0.05 by Mann–Whitney rank sum test). (E,G) Peritoneal macrophages were isolated from Rictorfl/fl and MRictor−/− mice (n = 4/group), and 2 days later treated with 0.5 M PA-BSA overnight (E,F) or human oxidized LDL (100 μg/ml) for 24 h (G). Annexin V/dead cell apoptosis kit was used to detect apoptotic cells; Note PA-BSA increases apoptosis more obviously in MRictor−/− than Rictorfl/fl macrophages; scale bars, 50 μm. Graphs represent data (mean ± SEM) of four mice/group; *p < 0.05 by Mann–Whitney rank sum test.

