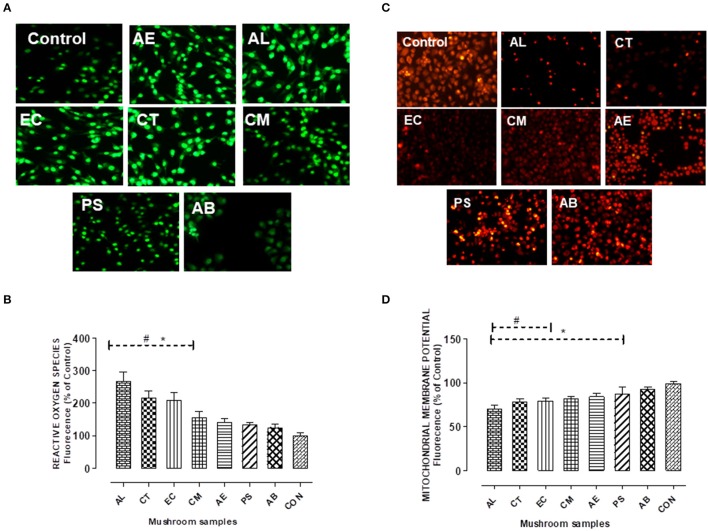
Figure 6.
(A,B) Detection of intracellular reactive oxygen species using the fluorescent probe H2DCFDA. Chang's Liver cells were exposed to the extracts for 24 h as indicated and the fluorescence levels in the attached cells was measured at 485 nm for excitation and 515 nm for emission. (C,D) Mitochondrial membrane potential changes were measured by the uptake of the cationic fluorescent dye Rhodamine 123. Histograms represent % increase (in case of ROS) and decrease (in case of MMP) in comparison to the control. Data presented are the means ± SD of results from three independent experiments. “#” and “*” represents significant difference with respect to AB and control respectively at p < 0.05.

