FIGURE 3.

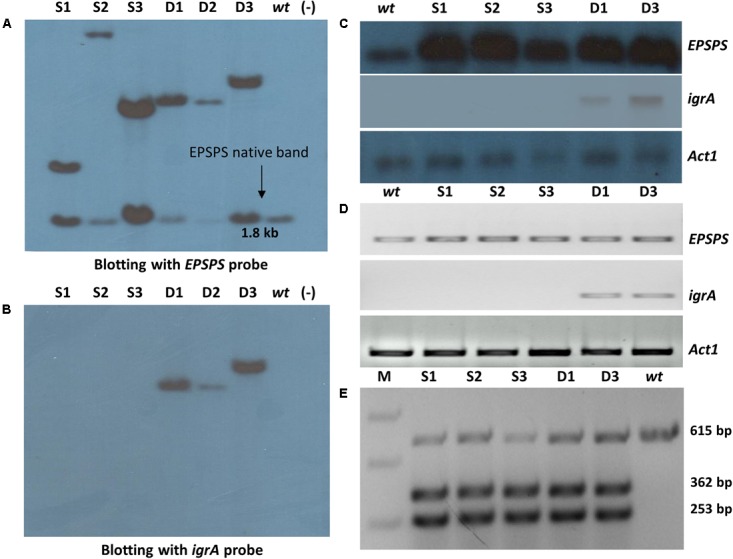
Molecular and expression analysis of transgenic plants. Southern blot signals confirm the presence of transgenes in ‘S’ and ‘D’ transgenic groups with EPSPS (A) and igrA gene probe (B). Confirmation of OsmEPSPS and igrA transgenes expression by Northern blotting (C) and semi quantitative RT-PCR (D) in ‘S’ and ‘D’ transgenic lines. The rice Act1 gene was used as reference gene in both experiments. Confirmation of P173S mutation in transgenic plants by restriction digestion of cDNA amplified PCR product of 615 bp with HindIII enzyme in wt and ‘S’ and ‘D’ group transgenic lines. The restriction digestion resulted in three bands of 615 bp, 362 bp and 253 bp, respectively, in all transgenic plants (E). The digested and undigested products showed the presence of expression of both native OsmEPSPS and trans OsEPSPS genes, respectively.
