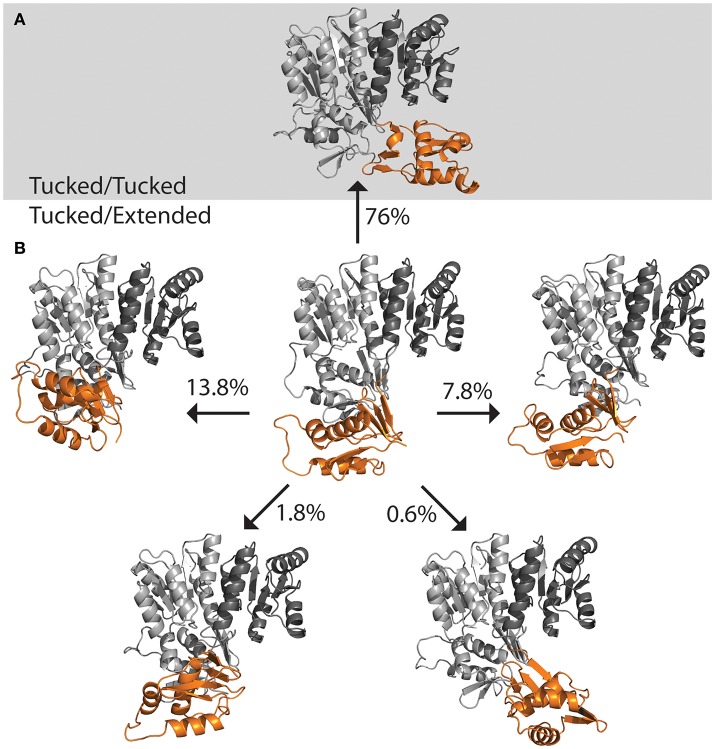
Figure 6.
Population distribution of PmrA. Having started with an “extended” state, the populations shifts to predominately “tucked” on a short time scale. (A) Molecular dynamics of PmrA (PDB ID 4S05) quickly relaxes to a “tucked/tucked” state and samples this state 76% of the time at a 250 ns time scale. (B) The PmrA crystal structure bound to DNA (center) begins in a “tucked/extended” state. Variations on the “tucked/extended” state are sampled for very short periods of time and account for small portions of the population at a given time. Structure models represent the top scoring pose from each cluster based on free energy minimization.

