
FIGURE 1.
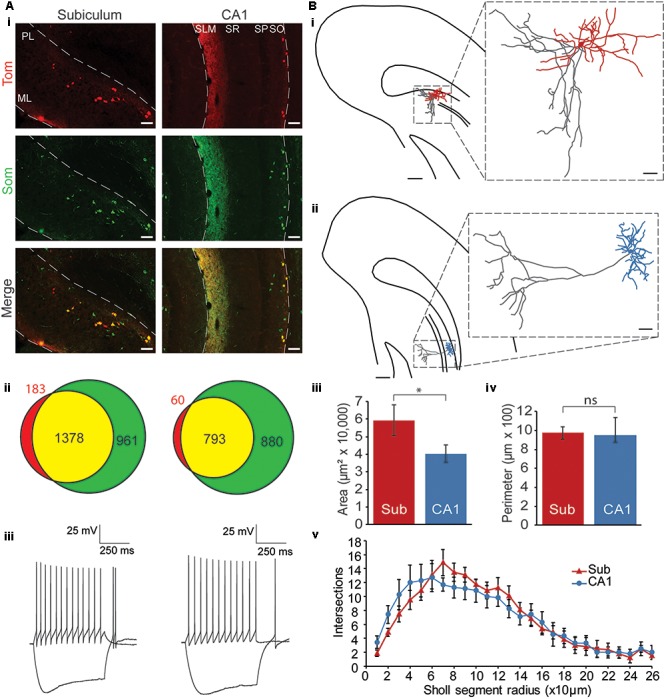
Characterization of Chrna2 cells. (Ai) Immunohistochemistry. 10× Images from a Chrna2-Tom animal treated with an anti-Som antibody. Chrna2 cell are visualized with Tom fluorescence in red. Som+ cells are in green. Co-expressing cells are shown in yellow. Left: subiculum. Right: CA1. ML, molecular layer; PL, polymorphic layer; SLM, stratum lacunosum-moleculare; SR, stratum radiatum; SP, stratum pyramidale; SO, stratum oriens. Scale bar = 100 μm. (Aii) Venn diagrams depicting proportions of Som+ and Tom+ cells. Tom+Som– cells in red, Tom+Som+ cells in yellow, and Tom–Som+ cells in green. Exact number of cells as indicated. Left: subiculum. Right: CA1. Animals: n = 4. Cells: subiculum, n = 2522; CA1, n = 1733. (Aiii) Representative Chrna2 cells recorded in subiculum (left) and CA1 (right). Traces showing current clamp (cc) recordings of responses to depolarizing and hyperpolarizing current steps. (Bi) Representative reconstruction of a subiculum Chrna2 cell. Hippocampus borders and pyramidal layer outlined. Soma and dendrites in red. Axon in gray. Scale bar = 250 μm. Inset: Enlarged reconstruction. Scale bar = 50 μm. (Bii) As in (Bi) for a CA1 Chrna2 cell. Soma and dendrites in blue. Axon in gray. (Biii) Mean area and (Biv) perimeter of the reconstructed dendritic trees of Chrna2 cells in subiculum (Sub, n = 8) and CA1 (n = 7). ∗p < 0.05. ns = not significant, p > 0.05. Error bars = SEM. (Bv) Number of intersections per Sholl segment for reconstructed dendritic trees of Chrna2 cells in subiculum (red, n = 8) and CA1 (blue, n = 7).