FIGURE 3.
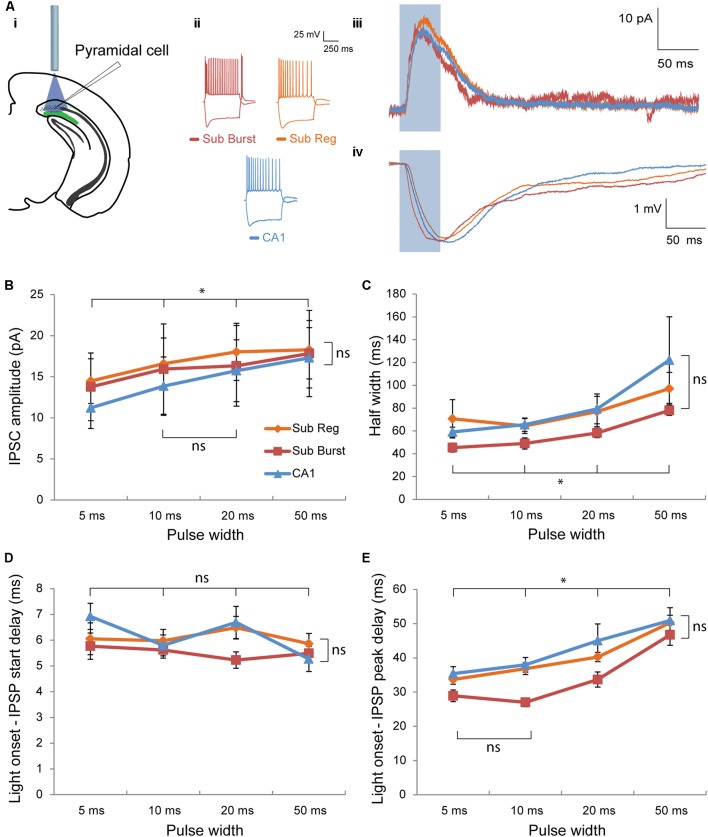
Post-synaptic responses elicited in pyramidal cells by optogenetic activation of Chrna2 cells. (Ai–Aiv) Representative pyramidal cells recorded in subiculum and CA1. (Ai) Diagram depicting optogenetic patch clamp experiment. (Aii) Responses to depolarizing and hyperpolarizing current steps in cc recorded in a representative subiculum burst firing (red), subiculum regular firing (orange), or CA1 (blue) pyramidal cell. Color scheme maintained throughout. (Aiii) Corresponding representative mean inhibitory post-synaptic current (IPSC) in response to a 50 ms light pulse (blue box) recorded in vc at an h.p. of –60 mV. (Aiv) Corresponding representative mean inhibitory post-synaptic potential (IPSP) in response to a 50 ms light pulse (blue box) recorded in cc at an h.p. of –60 mV. (B) Mean IPSC amplitude for all cells recorded across cell type and pulse width. Subiculum regular, n = 17; subiculum burst, n = 12; CA1, n = 10. Color legend maintained throughout the figure. (C) Same as in (B) for mean half width. (D) Same as in (B) for mean delay between light pulse onset and IPSP start. (E) Same as in (B) for mean delay between light pulse onset and IPSP peak. Error bars = SEM. ∗p < 0.05. ns, not significantly different, p > 0.05.

