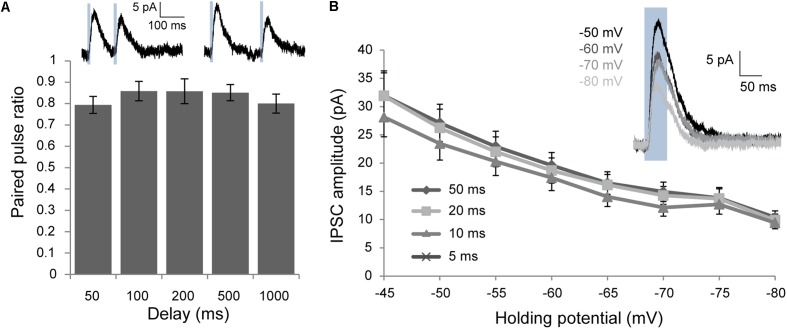
FIGURE 4.
Voltage clamp characterization of post-synaptic responses elicited by optogenetic activation of Chrna2 cells. (A) Mean paired-pulse ratio for delays for 50–1000 ms. n = 9 for 50 and 100 ms, n = 6 for 200, 500, and 1000 ms. Error bars = SEM. ∗p < 0.05. Inset (above): Example mean IPSCs recorded at an h.p. of –60 in response to two 10 ms blue light pulses (blue boxes) with a delay of 100 ms (i) or 200 ms (ii). (B) Mean IPSCs recorded at h.p.’s from –45 to –80 mV for 5–50 ms light pulses. n = 16. Error bars = SEM. Inset: Example mean IPSC in response to a 50 ms light pulse (blue box) at h.p.’s of –50 to –80 mV.

