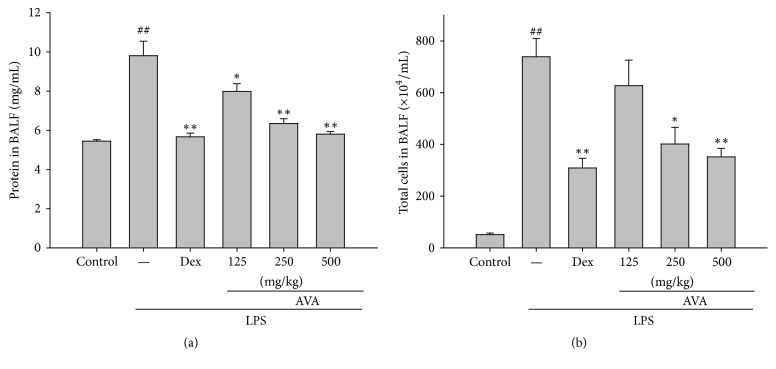
Figure 2.
Effects of AVA on the total protein level (a) and total cell number (b) in the BALF of LPS-induced ALI mice. Mice were given AVA (125, 250, and 500 mg/kg) by intraperitoneal injection 1 h before challenge with LPS. The BALF was collected 6 h after LPS challenge. Cell counts were assessed using a hemocytometer. Each value represents the mean ± SD. ## p < 0.01 compared with the control group. ∗ p < 0.05 and ∗∗ p < 0.01 compared with the LPS group (one-way ANOVA followed by Scheffe's multiple range test).

