
Figure 6.
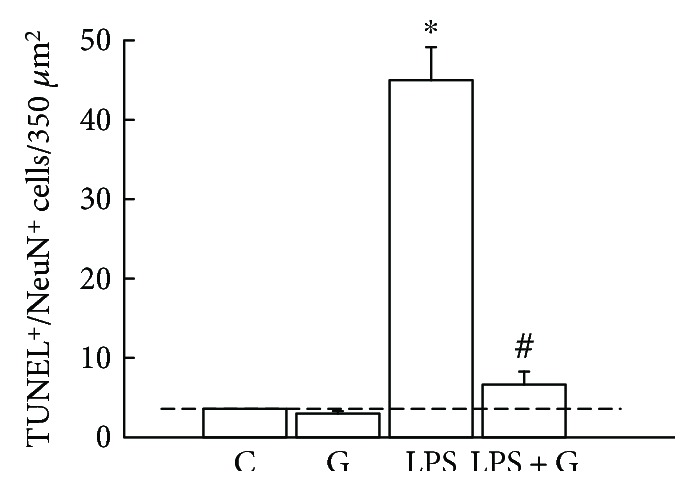
Quantified analysis of the effects of G-CSF on the increased expressions of neuronal apoptosis with LPS treatment. The experimental groups are indicated as follows: control (C), G-CSF (G), LPS (LPS), and LPS + G (LPS + G) (animals for each experimental group). Colocalization of neuronal nucleus- (NeuN-) positive and TUNEL-positive cells indicates apoptotic neuronal cells. ∗p < 0.05 compared with the vehicle-control group. #p < 0.05 compared with the LPS group. Data are presented as mean ± standard error of the mean.