Figure 3.

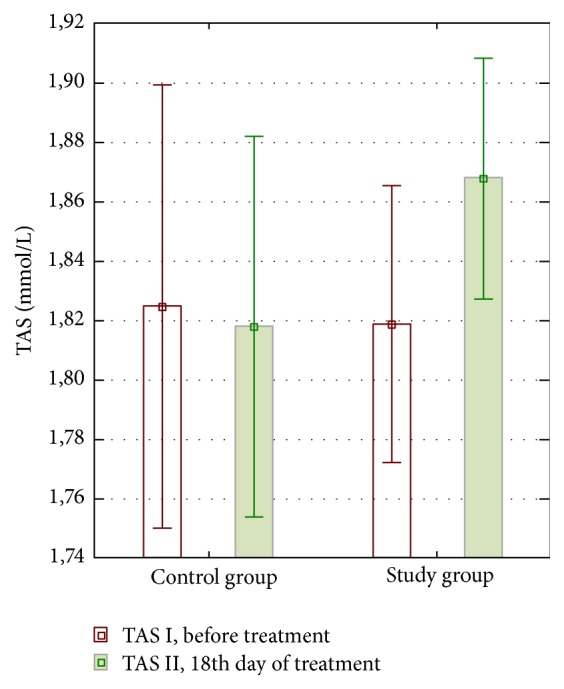
Distribution of TAS mean concentrations obtained in both groups at the first (TAS I) and second (TAS II) study point. The data are presented as mean and 95% Confidence Interval for each of the proper groups.

Distribution of TAS mean concentrations obtained in both groups at the first (TAS I) and second (TAS II) study point. The data are presented as mean and 95% Confidence Interval for each of the proper groups.