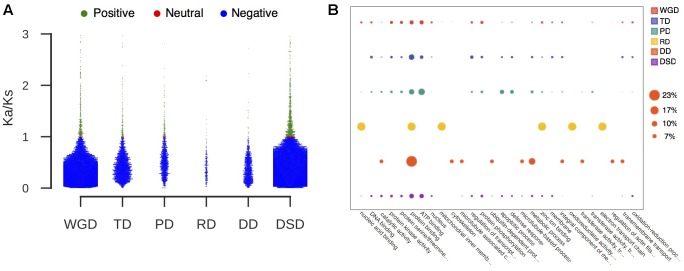
FIGURE 3.
The characteristic of duplicated genes that experienced positive selection. (A) The proportion of duplicated gene pairs under different selection pressure. Green dot: positive selection; red dot: neutral selection; blue dot: negative selection. (B) GO analysis of duplicated genes that experienced positive selection. The larger circle indicates a higher frequency of occurrence of a GO term.

