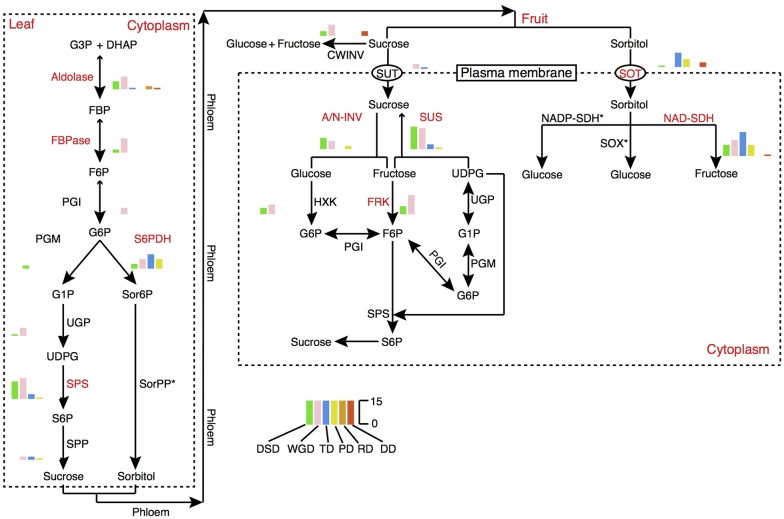
FIGURE 7.
The expansion pattern of gene families involved in sugar metabolism pathways. The expanded gene families are marked in red color. The histogram indicates the numbers of different modes of duplicated genes. A/N-INV, alkaline/neutral invertase; CWINV, cell-wall invertase; DHAP, dihydroxyacetone phosphate; FBP, fructose 1,6-bisphosphate; FBPase, fructose-1,6-bisphosphatase; F6P, fructose 6-phosphate; FRK, fructokinase; G1P, glucose 1-phosphate; G3P, Glyceraldehyde 3-phosphate; G6P, Glucose 6-phosphate; HXK, hexokinase; NAD-SDH, NAD-sorbitol dehydrogenase; NADP-SDH, NADP-sorbitol dehydrogenase; PGI, phosphoglucose isomerase; PGM, phosphoglucomutase; Sor6P, sorbitol 6-phosphate; SorPP, sorbitol-6-phosphate phosphatase; S6P, sucrose 6-phosphate; S6PDH, sorbitol 6-phosphate dehydrogenase; SOT, sorbitol transporter; SPP, sucrose phosphate phosphatase; SPS, sucrose phosphate synthase; SUS, sucrose synthase; SUT, sucrose transporter; SOX, sorbitol oxidase; UDPG, UDP-glucose; UGP, UDP-glucose pyrophosphorylase.

