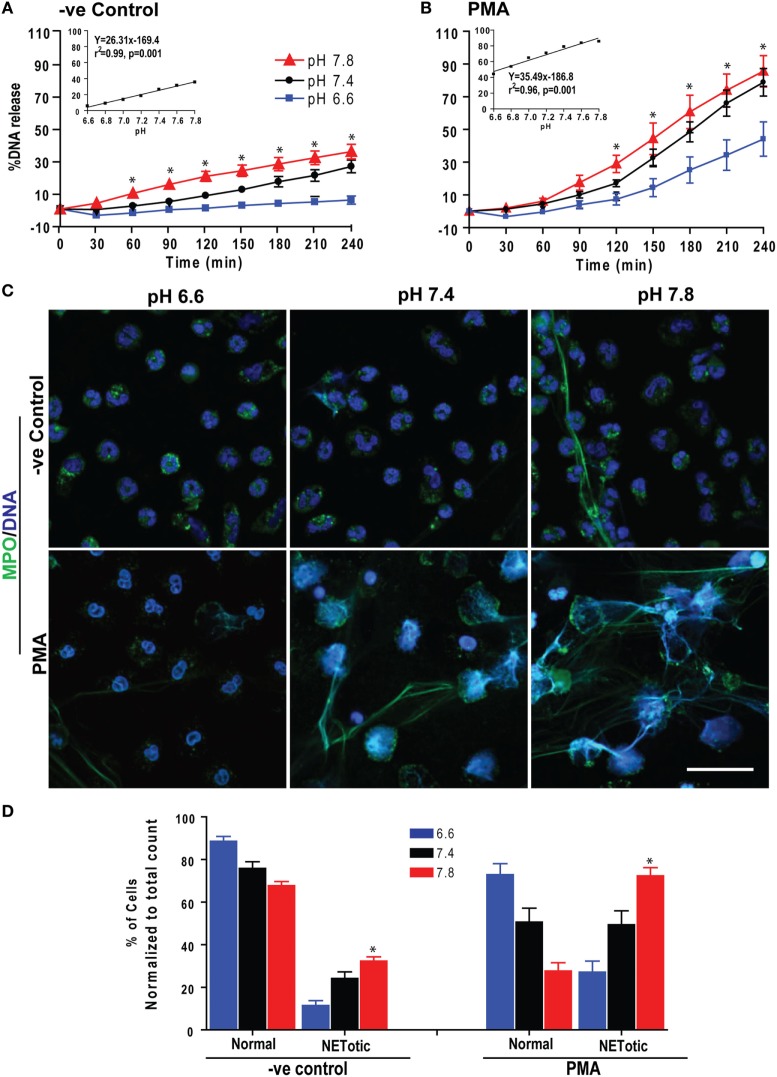
Figure 1.
Low extracellular pH (pHe) suppressed spontaneous and phorbol myristate acetate (PMA)-mediated NETosis. Neutrophils resuspended in media of predetermined pHe (6.6, 6.8, 7.0, 7.2, 7.4, 7.6, and 7.8) containing 5 μM Sytox Green dye were activated by either medium (−ve control) or PMA. Florescence was recorded by a plate reader for every 30 min up to 4 h. The percentage of DNA release (NETosis) was reported in comparison to an assigned value of 100% for the total DNA released by neutrophils lysed by triton-X. (A) The percentage of DNA release kinetics: neutrophils in higher pHe showed more NETosis. The inset regression graph of all seven pH conditions at 240-min time points showed a linear increment of the NETosis with increasing pH. (B) In neutrophils activated with PMA, low pH suppressed the PMA-induced NETosis parallel to decreased pH gradient, as shown in the kinetics and respective inset linear regression plots (n = 4–5; *p < 0.05; two-way ANOVA with Bonferroni’s posttest conducted at each time point; best fit linear regression analysis; error bars represent SEM). (C) Neutrophils resuspended in media of pH 6.6, 7.4, and 7.8 were activated by medium (−ve control) or PMA for 120 min. The fixed cells were immunostained for myeloperoxidase (MPO) and DNA. Confocal images showed the intact morphology of the nuclei in media control and PMA-activated neutrophils in low pH media. At higher pH, MPO colocalized to neutrophil extracellular trap (NET)-DNA generated by control and PMA, although the amount of NETosis was much higher in PMA-activated compared to control cells (blue, DAPI staining for DNA; green, MPO; n = 3; scale bar 20 μm). (D) The percentages of normal, decondensed, or puffed and NET-like (NETotic) cells were calculated based on the MPO, DAPI staining, MPO-DAPI colocalization, and nuclear morphology. The quantitative analyses confirm the qualitative analyses of the NETs status in neutrophils under pH conditions either treated by media only (−ve control) or PMA (n = 3; *p < 0.05, comparing the condition between pH 6.6 and 7.8; one-way ANOVA with Tukey’s multiple comparison posttest). See additional details in Figure S1 in Supplementary Material.

