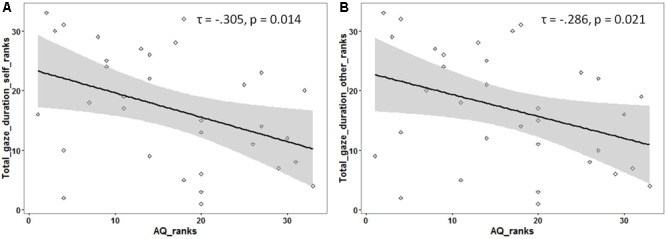
FIGURE 3.

Rank scatterplots representing the negative association between the AQ scores with the total gaze duration for faces identified as (A) ‘self’ and for faces identified as (B) ‘other.’ The shaded portion represents the 95% confidence region of the slope of the regression line.
