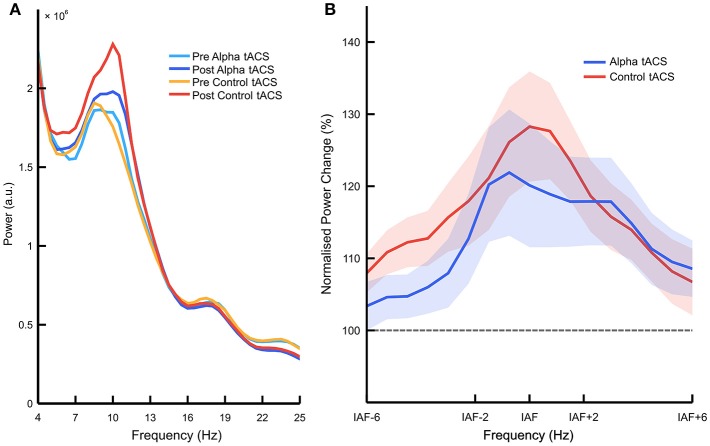
Figure 3.
Effects of alpha vs. control tACS on overall alpha power. (A) Raw EEG power spectra. Mean power is plotted between 4 and 25 Hz, averaged over posterior electrodes (i.e., PO7, PO8, P3, and P4) before vs. after the delivery of alpha vs. control tACS. (B) Normalized percentage change in EEG power. Relative changes in posterior EEG power (i.e., post-tACS/pre-tACS) are plotted for alpha vs. control tACS. Individualized alpha bands were defined as 2 Hz above and below individualized alpha frequency (IAF). Alpha tACS was not found to exert an influence on EEG alpha power beyond that of control tACS. Shading shows ±1 standard error of the mean.

