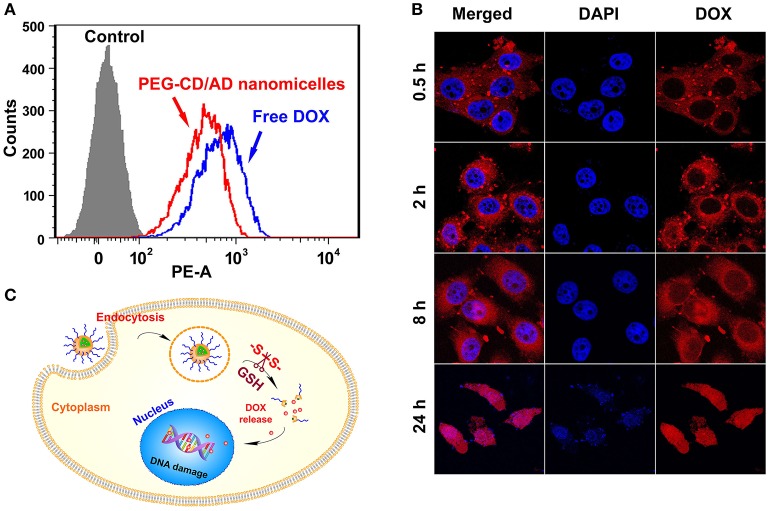
Figure 4.
Cellular uptake and intracellular locations of PEG-CD/AD nanoparticles in HepG2 cells. (A) Flow cytometry analysis of the cells with the treatments of PEG-CD/AD nanoparticles for different time. (B) Confocal images of the cells. (C) Schematic illustration of cell internalization of PEG-CD/AD nanoparticles and intracellular release of DOX.

