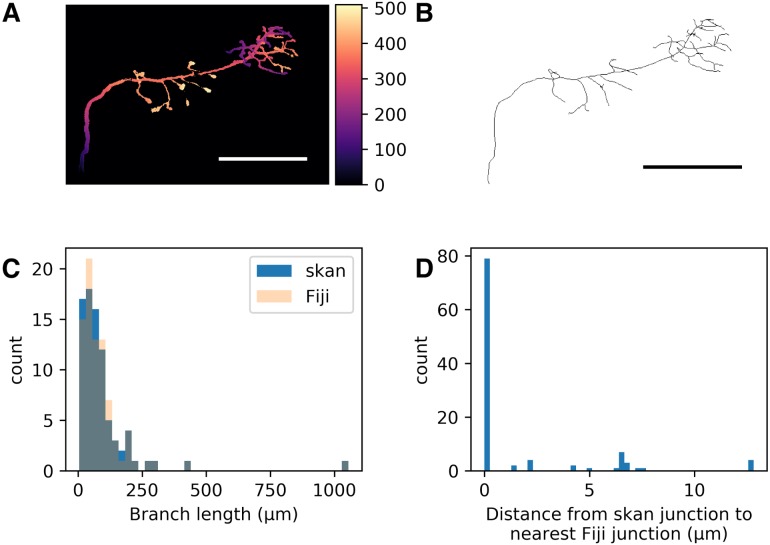
Figure 1. Comparison of skan and Fiji analysis results of the neuronal skeleton from olfactory projection neuron 1 (OP-1) from the DIADEM challenge.
(A) Depth projection of the neuron. Scale bar: 500 μm. Colour map: height in μm. (B) Skeleton of the neuron. (C) Distribution of 82 branch lengths between 103 branch points measured by Skan and Fiji in the neuronal skeleton. (D) Distance from 103 skan junction points to the nearest Fiji junction point. Note that the voxel spacing is approximately 9 × 3 × 3 μm, so almost all of these distances are less than one pixel apart.

