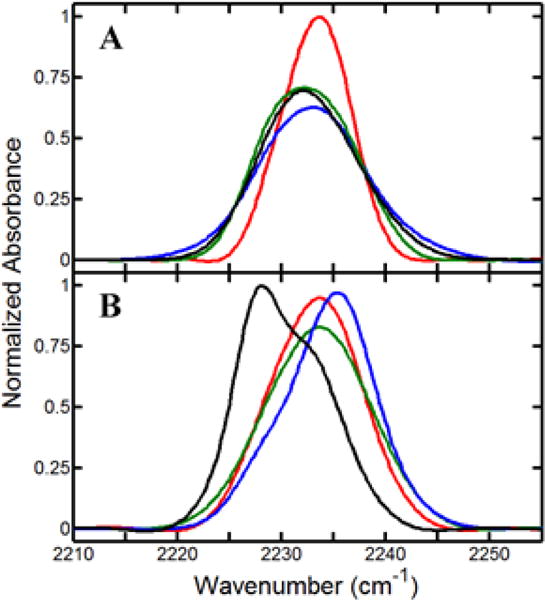
Figure 4.

FT IR spectra of CN for substrate-free Y96CNF (black) and complexes with camphor (blue), isoborneol (green), and camphane (red), both (A) without CO and (B) with CO. All spectra are averages of at least three unique trials, and spectra in both panels are normalized by integrated area.
