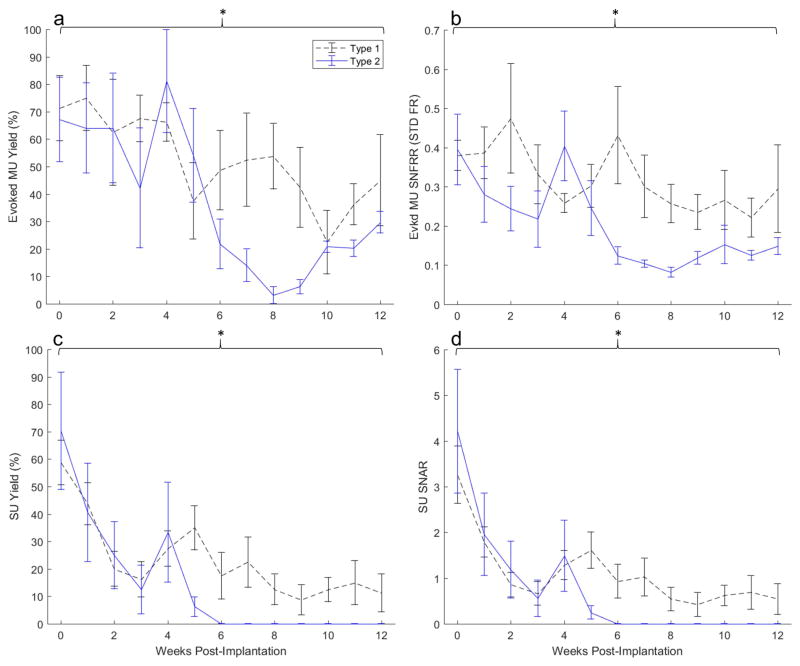
Figure 4.
Electrophysiological performance of Type 1 encapsulated arrays (black dashed) compared Type 2 (blue). Average evoked multi-unit yield (a), evoked multi-unit signal-to-noise firing rate ratio (b), single-unit yield (c), and single-unit signal-to-noise amplitude ratio (d) between encapsulation groups from weekly recordings over a 12-week period. Brackets indicate an overall (group-wise) significant treatment effect of encapsulation type on MU yield, MU SNFRR, SU yield, and SU SNAR (p = 0.0038, p = 0.0001, p = 0.0099, and p = 0.0472 respectively.

