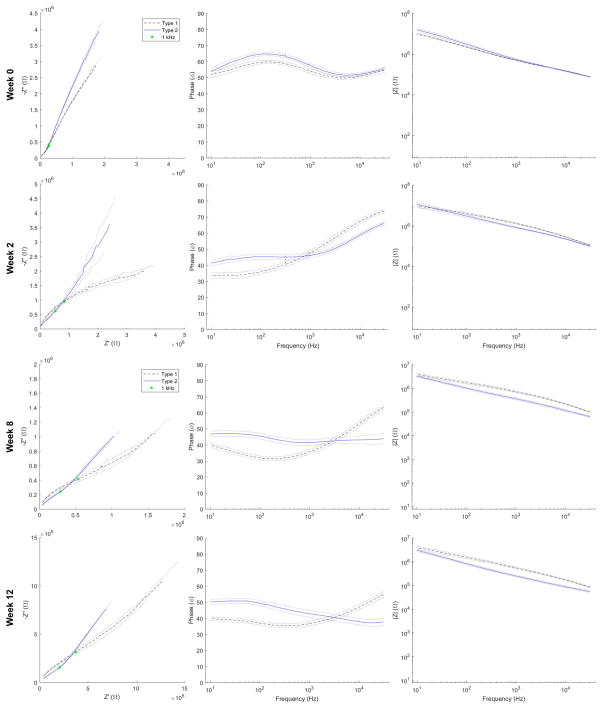
Figure 7.
Nyquist (left), phase (middle), and Bode (right) traces averaged across all channels between types at week 0, 2, 8 and 12. Dotted lines indicate ± SEM. Green dot indicates impedance at 1 kHz. Note more pronounced high impedance semicircular feature in Type 1 averaged Nyquist traces week 2 onward, trend for lower phase below 1 kHz for Type 2 implants, and lower magnitude impedance from Type 2 arrays across a broad range of frequencies from week 2 onward.

