Figure 7.

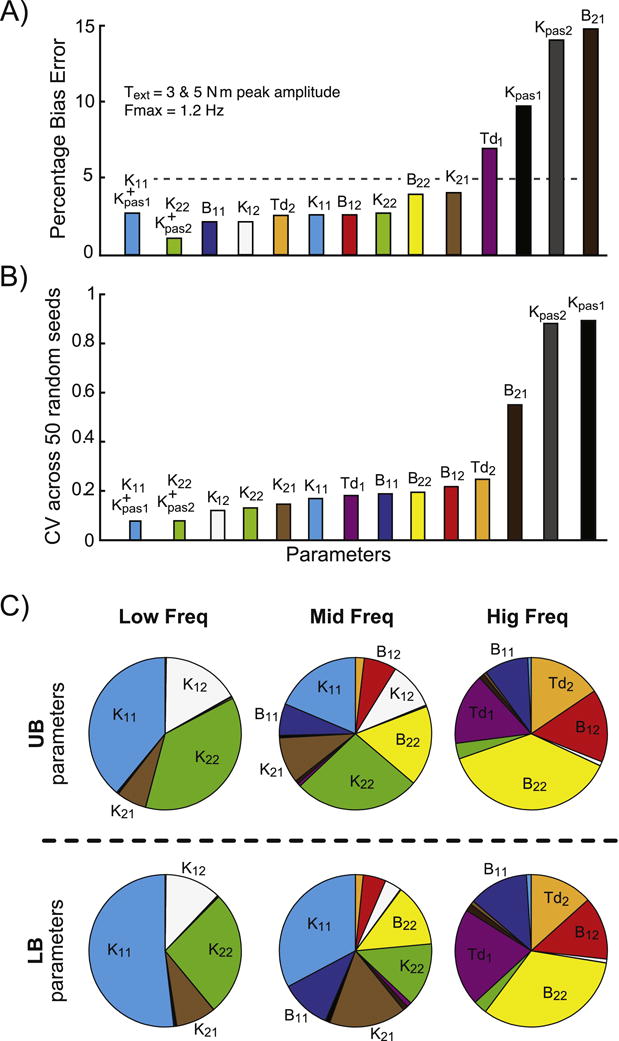
A) Bias percentage errors in parameters when the fitting routine included frequencies from 0.023 to 1.2Hz. Errors shown are an average of results from simulations with an external torque (Text) amplitude of 3 and 5 N.m. B) Coefficient of variation across the 50 different realizations of sensory noise for the same fitting and torque conditions shown in A). In C), the sensitivity pie chart displays the relative impact of each parameter (when modified by ±10%) on the upper body and lower body frequency response functions (FRFs) at low (0.023–0.3 Hz), mid (0.43–2.5 Hz), and high (3.2–8.0 Hz) frequency bands.
