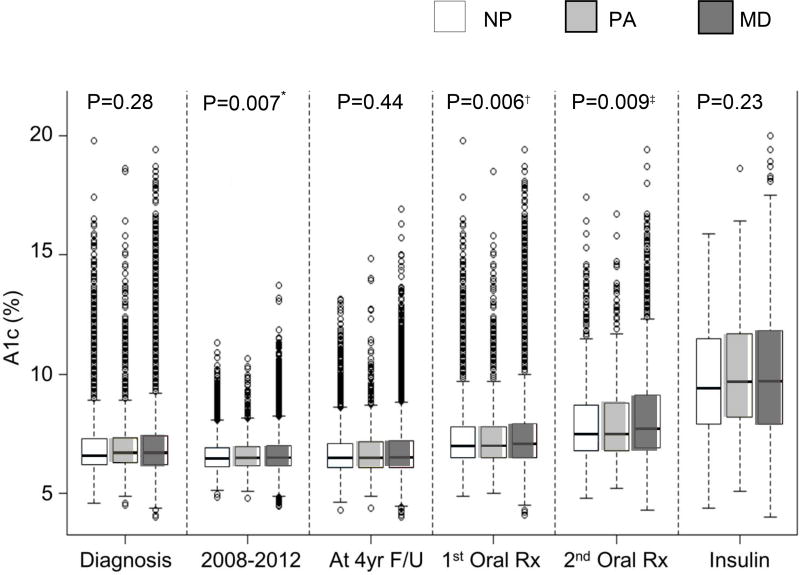
Figure 2. Median HbA1c levels at systematic time points in the natural history of diabetes in patients newly-diagnosed in 2008.
Box and whisker plots of median patient HbA1c levels compared between patients at various time points in the natural history of diabetes: 1) within 12 weeks before/6 weeks after diabetes diagnosis, 2) each patient’s mean HbA1c over 5 years from 2008–2012, 3) after four years of primary care follow-up in 2012, 4) at initiation of first oral antihyperglycemic medication, 5) at initiation of second oral antihyperglycemic medication, and 6) at initiation of insulin. Boxes include 25th–75th percentile, dashed lines indicate min-max range, dots represent outliers. Group P values shown were calculated using Kruskal-Wallis tests. Wilcoxon tests were used to compare HbA1c between two provider groups.

