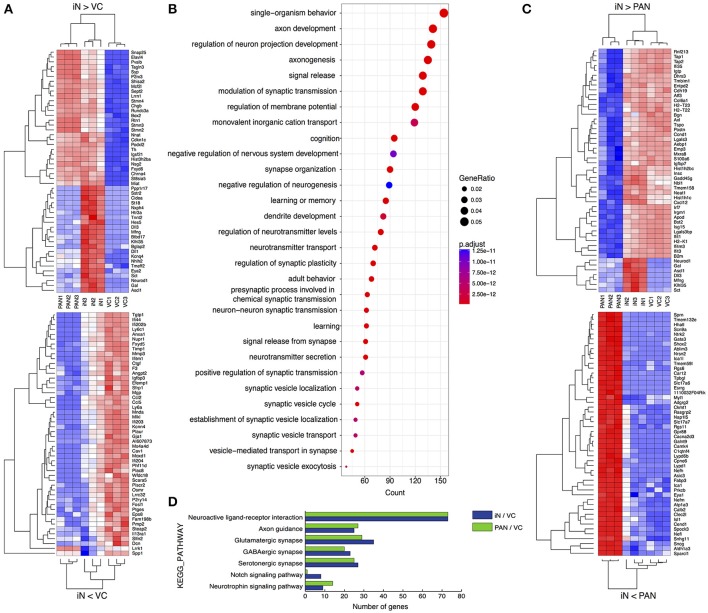
Figure 6.
Comparative transcriptome analyses of PANs, iNs, and VCs. (A) Heatmaps drawn for 50 positively (upper) or negatively (lower) variant genes between iN and VC. (B) Gene ontology analysis for neuronal induction. Upregulated DEGs were extracted in iN against VC and performed GO analysis. The top 30 biological process terms are shown. The diameter of each circle indicates the gene ratio. The color of each circle indicates adjusted p value as shown to the right of the panel. (C) Heatmaps drawn for 50 positively (upper) or negatively (lower) variant genes between iN and PAN. (D) Pathway analysis comparing PAN and iN. Upregulated DEGs of PAN and iN against VC were analyzed on KEGG database.

