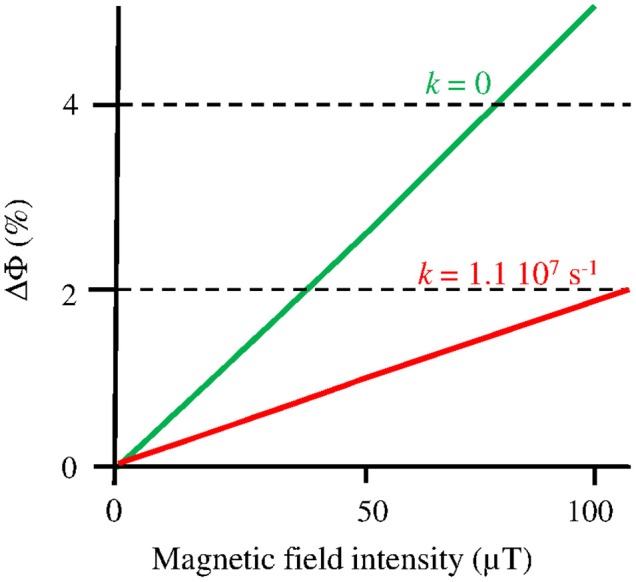
Figure 2.

Change (%) of the yield (Φ) of FADH• in AtCry 1, thus of the constant k1 of its photoreduction, according to the intensity B of a static MF under flash photolysis (adapted with permission from Maeda et al., 2012, © National Academy of Sciences of the United States of America). The graph focuses on the Earth strength range, where the MF effect is to increase Φ (k1). The function ΔΦ(B) is shown here for kSTD (k) = 1.1 107 s−1, where it best fits the experimental observations, and for kSTD = 0, which can be the case in vivo (see text).
