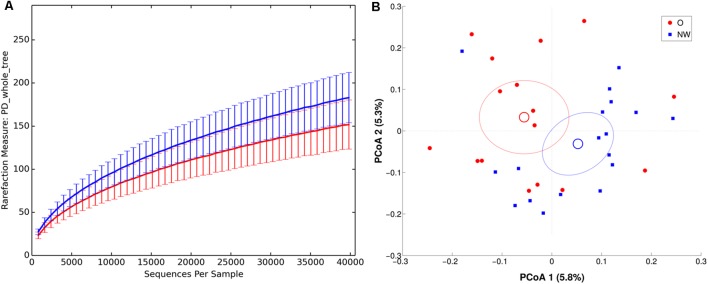
FIGURE 5.
α and β diversity in LAM samples. NW samples are in blue, whereas O are in red. (A) α-diversity plot of LAM microbiota according to PD whole tree metric. Differences are statistically significant (p < 0.01). (B) PCoA according to unweighted Unifrac distance, showing a significant (p = 0.017) separation between the two groups.

