FIGURE 1.

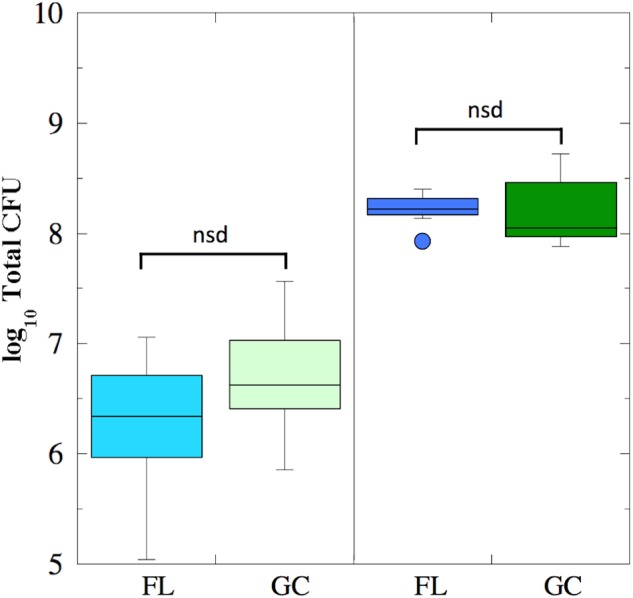
Box plots depicting growth (presented as log10 Total CFU) of B. subtilis FL (cyan and blue boxes) and GC (light and dark green boxes) samples during the BRIC-18 (left panel; n = 5) and BRIC-21 (right panel; n = 7) experiments. nsd, not significantly different (Kruskal–Wallis, P > 0.05).
