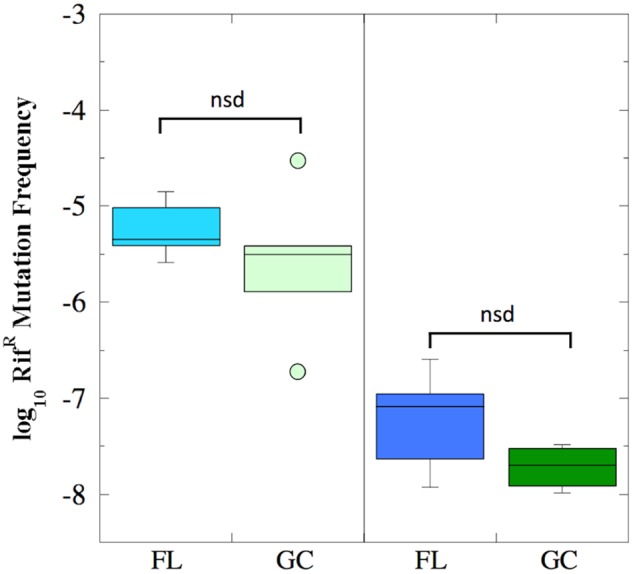
FIGURE 2.

Box plots depicting the frequency of RifR mutations (presented as log10 values) of B. subtilis FL (cyan and blue boxes) and GC (light and dark green boxes) samples during the BRIC-18 (left panel; n = 5) and BRIC-21 (right panel; n = 6) experiments. nsd, not significantly different (Kruskal–Wallis, P > 0.05).
